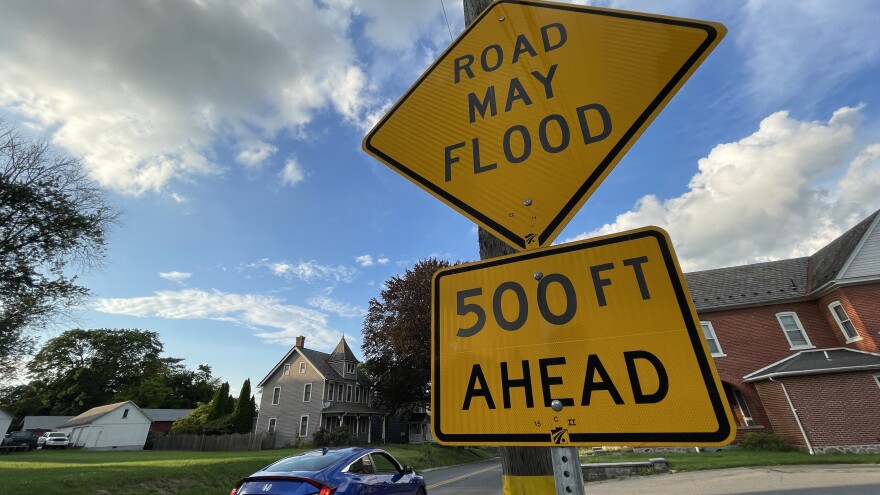
BETHLEHEM, Pa. — A new survey out of Lehigh University aims to capture residents’ opinions about flooding and drought.
“We’re trying to learn how — not only Bethlehem, but actually the entire Lehigh Valley — residents handle, or how they foresee they will handle, what we call a water-extreme event, including both flood and drought,” Ethan Yang, associate director of the Center for Catastrophe Modeling and Resilience, said.
“The reason why we are doing this survey is because we’re trying to build scientific models and trying to simulate the impact of an extreme weather event, and then we want to incorporate people's reactions into our model to make it more realistic.”
Available through mid-December, the survey is open to residents across the Lehigh Valley. And, there’s some incentive, too — residents who complete the survey will be entered to win one of five $20 Amazon gift cards.
The purpose of the project, Yang said, is twofold — to create a model with actionable tools to help municipal leaders and residents prepare for extreme weather events, but also to add a human perspective.
“The novelty of the project is we try to incorporate the human modeling part into those previous models, and that's why I say it will help us as scientists to make our model more realistic. So then the result that we get will be more reasonable for the local authority to use.”Ethan Yang, associate director of the Center for Catastrophe Modeling and Resilience
“The novelty of the project is we try to incorporate the human modeling part into those previous models, and that's why I say it will help us as scientists to make our model more realistic,” Yang said.
“So then the result that we get will be more reasonable for the local authority to use.”
Local, regional data
The survey is part of a project out of Lehigh’s Climate Resilience Center.
The center, which operates out of the university’s Catastrophe Modeling Center, was created last year after Yang and a team of researchers at the university received a $1 million, three-year award from the U.S. Department of Energy.
“The researchers will consider the effects of [Climate Action Plan] coordination in a region, assess the effects of the CAPs’ actions (for example, do they offset or amplify extreme weather effects), and investigate how different population groups respond, with particular interest in the responses of people who are members of disadvantaged communities,” officials said in an August 2024 news release announcing the award.
“In this research, Yang is drawing on the principles of catastrophe modeling, a field of study with roots in the insurance industry that helps predict risk when risk is unpredictable — it’s a way of helping insure items or property when there are few historical precedents, such as an off-the-scale hurricane, for example.”
The project is still in its first phase, which includes collecting data about precipitation and temperature, as well as administering the survey to residents.
In addition to the local survey, there is also a regional survey, Yang said, that encompasses much of Pennsylvania and New Jersey.
So far, the regional survey has netted more than 900 responses. The local one has less than a dozen.
“Obviously, the more the better, but that's the target we are shooting for.”Ethan Yang, associate director of the Center for Catastrophe Modeling and Resilience
“Ideally, if we can get at least 30, that will be great,” Yang said. “ … The reason I mentioned that 30 number is because in order to make any meaningful statistical analysis, that's the minimum number of the sample that we need.
“Obviously, the more the better, but that's the target we are shooting for.”
Once the survey is closed, researchers will use the answers to create a computer model.
“The key part is the local survey, [which] will actually help us to figure out whether the model that we build is reasonable or not,” he said. “Because, eventually, we want our model to be used by a local authority, or results can be shared with local residents.
“So, we have to make sure that our model at least can somehow fit the local people's opinions. In academia, there are several different ways to do this, so we use a larger data set to build a more, I would say, more general model, and then we use the local data set from the survey to sort of like fine-tune, or try to modify the model to make it more realistic for the local situation that we need to use.”
What’s in the survey?
The survey is made up of about 60 questions, Yang said, with respondents able to choose answers like strongly agree, agree, neutral, disagree and strongly disagree.
“Because the main purpose for the survey is for us to improve our modeling, either setup or results,” he said. “So, the way we set out the questions, we will need a way to convert people's opinion into quantifiable values that we can use in our model.”
It should take about 20 minutes to complete, he said.
“First of all, we asked some common questions for demographic information, like their education, their annual incomes,” he said. “But, some specific things that we asked is, for example, How long have you — the participant of the survey — lived in this neighborhood?
“Because, in the following survey question, we also asked them whether they trust their neighbors or what's their relationship with their neighbors,” he continued. “So, that will become one of the factors. We also ask whether you have a car, are you homeowners or are you renters, things like that.”
The second and third parts of the survey have questions related to drought, referred to as a water shortage, and flooding adaptations, he said.
The first question asks about residents’ understanding of a water shortage condition based on their previous experiences.
For example, Is there a water shortage when officials ask or order residents to reduce their water use, or when the resident themself notices there’s been no precipitation for a few months?
“Then, we ask them follow-up questions like, How do you feel about your connection with the community? Do you think you are going to help your neighbors if you are facing some difficulty?” he said.
After that, there are water shortage-specific questions, like if residents prepare and how. Then, there’s a scenario-based question. Assuming officials issue orders to reduce water usage, what actions would residents prefer to take?
“And, for flooding, we also ask a sort of a similar concept question,” Yang said. “We ask them, Have you ever experienced flooding before? If you did, does the flood cause any damage or cause any inconvenience in your life?”
Questions in this section ask residents about their plan in case of flooding, if they have flood insurance or plan to take action to mitigate future flood risk.
With the survey closing next month, results are expected early next year.
Residents interested can take the survey online.


