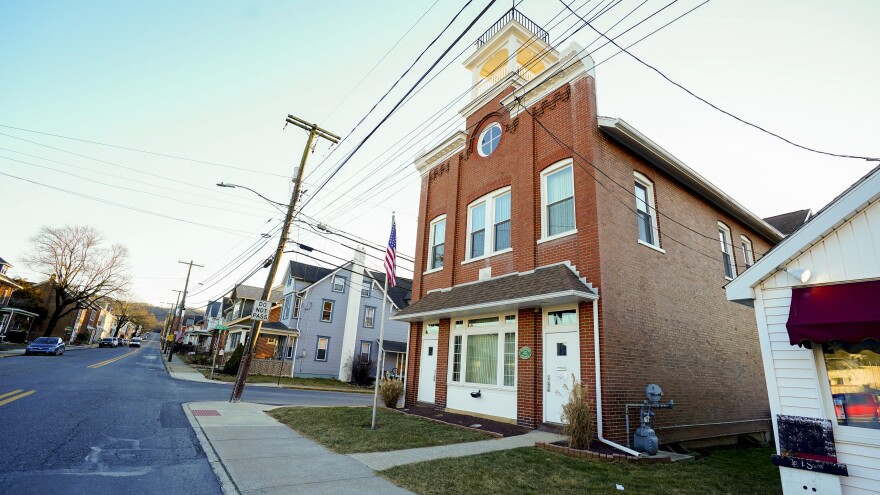
BETHLEHEM, Pa. — There are 41,618 unique ZIP codes in the United States, and Macungie ranked in the top 0.02% in an annual report from Realtor.com this week.
The borough was heralded Tuesday as one of the Hottest ZIP Codes of 2024, ranking 10th in the nation.
But Macungie, one of the communities served by members of the Greater Lehigh Valley Realtors, is just one in a list of examples where the demand for homes in the area has continued to surge.
“Macungie’s growing appeal is a testament to its vibrant community, excellent opportunities for education and proximity to key amenities, making it a prime destination for homebuyers,” 2024 GLVR President-elect Michael Bernadyn said.
According to the July market report from the Greater Lehigh Valley Multiple Listing Service, Macungie (in the East Penn district) is showing gains across almost all key housing metrics.
The stats below are 2024 vs. 2023:
New Listings: 383 vs. 465 (+21.4%)
Pending Sales: 363 vs. 387 (+6.6%)
Closed Sales: 367 vs. 355 (-3.3%)
Average Sale Price: $394,801vs. $428,842 (+8.6%)
Inventory (July vs. July): 46 vs. 79 (+71.7%)
But here’s how some other areas across Lehigh and Northampton counties stack up:
Northwestern Lehigh
New Listings: 59 vs. 98 (+66.1%)
Pending Sales: 50 vs. 75 (+50%)
Closed Sales: 44 vs. 66 (+50%)
Average Sale Price: $550,291 vs. $494,224 (-10.2%)
Inventory (July vs. July) 13 vs. 18 (+38.5%)
Catasauqua
New Listings: 91 vs. 134 (+47.3%)
Pending Sales: 69 vs. 92 (+33.3%)
Closed Sales: 65 vs. 90 (+38.5%)
Average Sale Price: $304,114 vs. $356,740 (+17.3%)
Inventory (July vs. July): 25 vs. 22 (-12.0%)

Saucon Valley
New Listings: 105 vs. 142 (+35.2%)
Pending Sales: 90 vs. 121 (+34.4%)
Closed Sales: 96 vs. 103 (+7.3%)
Average Sale Price: $520,928 vs. $568,433 (+9.1%)
Inventory (July vs. July): 18 vs. 21 (+16.7%)
Parkland
New Listings: 423 vs. 526 (+29.1%)
Pending Sales: 377 vs. 475 (+26%)
Closed Sales: 348 vs. 397 (+14.1%)
Average Sale Price: $429,450 vs. $463,132 (+7.8%)
Inventory: 78 vs. 93 (+19.2%)
Easton
New Listings: 465 vs. 578 (+24.3%)
Pending Sales: 411 vs. 476 (+15.8%)
Closed Sales: 368 vs. 403 (+9.5%)
Average Sale Price: $350,011 vs. $386,116 (+10.3%)
Inventory: 73 vs.89 (+21.9%)
Lehigh Valley Trends

Most Lehigh Valley districts boast list prices below the current national median of $439,950 as of July (when compared with Realtor.com data).
The highest average sale price is in Southern Lehigh ($624,124), while Saucon Valley had the next highest average ($568,433).
The area with the largest gain overall was Catasauqua, jumping 17% to $356,740.
Relatively high demand also continues to push home prices across the area above the average gain (+7.4%) of the hottest ZIPs in the nation in the first half of the year.
Beyond Catasauqua, areas such as Allentown had a 14.3% increase vs. just a 0.4% median listing price growth nationally.
If you’re searching for a home in the area, you better act fast in Allentown. Homes are spending an average of just 21 days on the market in the area.
Other spots with listings seeing quick deals include Macungie (23 days), Bethlehem (27 days), Emmaus (28 days), Easton (28 days) and Catasauqua (29 days), according to Realtor.com.


