
BETHLEHEM, Pa. — Air pollution in the Lehigh Valley is highest in urban areas near roads and at industrial sites, but it's also prone to fluctuations, according to a $100,000 regional air monitoring project.
“Urban near-road and industrial sites experienced the greatest impacts, with elevated baseline concentrations and extreme short-term peaks,” researchers said.
“Analysis across multiple timescales was crucial for identifying the timing and sources of this pollution, revealing that rush hour traffic likely drives morning peaks, while truck traffic near warehousing sites likely drives mid-day peaks, with industrial activity and meteorological factors playing a key role in overnight elevations.”
A little more than a month after officials announced Lehigh Valley Breathes was advancing from the data collection to analysis phase, the first update has been released.
The data snapshot includes three comparisons looking at fine particulate pollution across eight monitoring locations, including urban, rural and residential neighborhoods.
“Understanding both the when and the where of pollution is an essential first step in understanding how it relates to public health, and it is necessary for designing targeted, evidence-based air quality management policies."Lehigh Valley Breathes
“Understanding both the when and the where of pollution is an essential first step in understanding how it relates to public health," officials said.
"And it is necessary for designing targeted, evidence-based air quality management policies."
While this is the first analysis released since data collection finalized in late August, officials said it only represents a small portion of the total data collected.
Additional analyses planned to be released ahead of a final report, expected next year.
‘Three widely separated locations’
The report includes three comparisons, each looking at average levels of PM 2.5 over a month in 2024.
PM 2.5 are particles so small they’re invisible to the naked eye, but made up of a mix of chemicals that can get deep into the lungs and can cause health problems.
They are measured in micrograms per cubic meter, or µg/m3.
The analysis includes an hourly average distribution of PM 2.5, as well as daily averages, which highlights short-term peaks and helps to identify variations in air quality, like sustained levels of elevated pollution, respectively.
There’s also diurnal averages. For that measure, researchers took the average hourly reading over a month to create an hour-by-hour average.
The first compared PM 2.5 data in “three widely separated locations” in July 2024, two in Northampton County and one in Lehigh County.
They are Portland, an isolated rural residential neighborhood; Freemansburg, a suburban area within the urban corridor; and a heavily trafficked road in a dense urban area of Allentown, south of American Parkway, denoted with the acronym PNLV.
The Portland monitoring site consistently exhibited the lowest concentrations, representing regional background levels, while the urban near-road PNLV site recorded the highest concentrations and most severe peaks, highlighting the strong influence of traffic emissions.
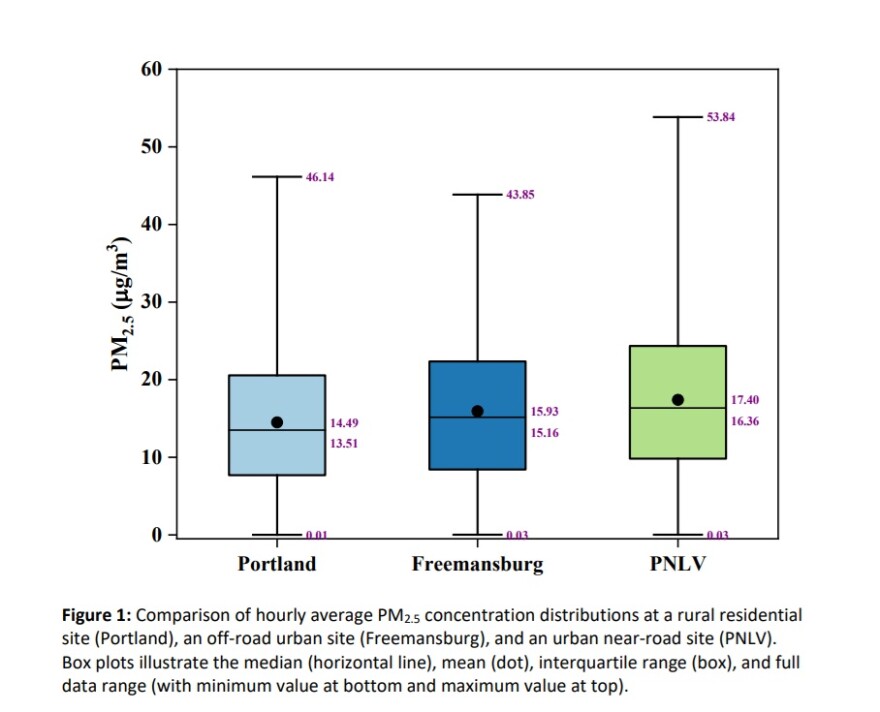
“The rural Portland site consistently exhibited the lowest concentrations, representing regional background levels, while the urban near-road PNLV site recorded the highest concentrations and most severe peaks (up to 53.84 µg/m3), highlighting the strong influence of traffic emissions,” according to the analysis.
The PNLV site’s PM 2.5 concentrations peak between 7 a.m. and 9 a.m., “which might be the signature of rush-hour traffic emissions,” officials said.
However, researchers noted all three sites see a similar spike ahead of rush hour, between 3 a.m. and 4 p.m., suggesting “valley-wide meteorological or geographical factors are playing a significant role in the first peak in pollution."
Industrial parks
The second comparison uses monitors set up near three industrial parks, also using data collected during July 2024.
They are: HellertownBIP, a heavily trafficked urban area situated between an industrial park and Interstate 78; IronRunIP-SG, a suburban area on the northern edge of the Valley’s largest industrial park; and BathIP, a semi-rural area between two industrial parks and just east of a cement plant.
Researchers found a “remarkable similarity” — there were nearly identical mean concentrations and comparable maximums at both HellertownBIP and IronRunIP-SG, even though the former is near a major highway and the other is not.
However, the BathIP monitor recorded an extreme maximum of 78.33μg/m3 — a peak event about double that of the other warehouse locations.
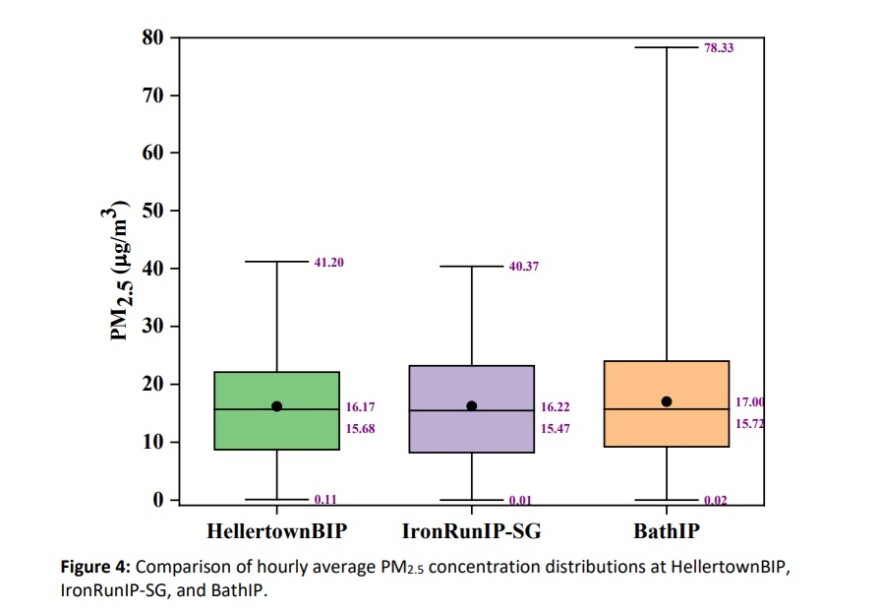
“This finding strongly suggests that while different warehouse operations may produce a consistent and comparable air quality footprint, heavy industrial sources like the cement plant are in a distinct category, characterized by severe, intermittent high-emission events,” according to the analysis.
Looking at the hourly data, there are significant differences in the timing of peak concentrations.
Data from the HellertownBIP site “exhibits a classic bimodal traffic pattern,” researchers said, with prominent peaks corresponding to the morning, about 7 a.m., and evening, about 7 a.m., commutes, “consistent with its proximity to a major highway.”
“In contrast, IronRunIP-SG's concentrations peak later in the morning (approx. 10:00 a.m.), which might be aligning with typical logistical and warehouse operational hours,” according to the analysis.
“Similarly, the early afternoon (approx. 2:00 p.m.) peak at HellertownBIP may align with heightened warehouse related truck traffic between rush hours, as truckers try to get to the Industrial Park before the afternoon rush hour begins.”
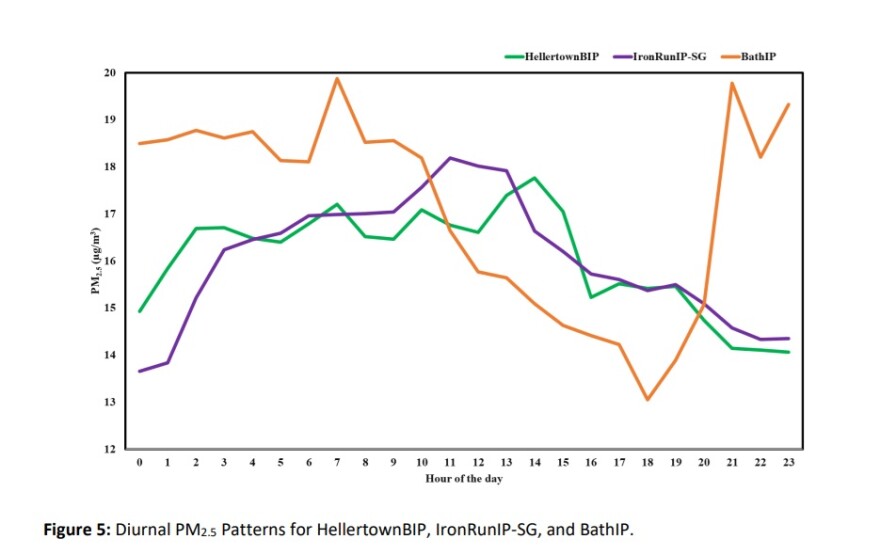
The BathIP site, however, “displays a unique inverse pattern,” researchers noted, with highest concentrations during overnight and early morning hours.
That inverse pattern “strongly suggests its pollution profile is dominated by industrial process schedules (at the cement plant) and nocturnal meteorological conditions that trap emissions,” officials said.
While all three industrial sites have a similar daily and hourly average concentration of PM 2.5, the BathIP site displays the highest median with the tightest range.
“This finding strongly suggests that while the overall pollution load is comparable across these sites, the emissions profile from the cement plant results in a less variable, chronically high concentration environment, whereas the warehouse sites show slightly wider operational variability,” according to the analysis.
“Maximum daily concentrations at all three sites were also comparable (~30-32 µg/m3), suggesting that while short-term events occur, they are not as extreme as those in heavily trafficked locations, such as PNLV.”
Bethlehem sites
The third comparison looked at two residential monitoring sites in Bethlehem during August 2024.
The sites include Kirkland, representing a low-traffic environment, and HWY378&Brighton, representing a high-traffic environment.
The hourly average data for the two locations demonstrates the impact of vehicle emissions, according to the analysis, with the high-traffic site showing a higher average concentration of PM 2.5.
“This finding strongly suggests that the high traffic volume at the Brighton site contributes to both an elevated pollution baseline over the general urban background and more frequent, high-magnitude emission events,” researchers said.
When PM 2.5 concentrations are averaged by hour, it shows the Brighton site “exhibits persistently and significantly higher concentrations than the low-traffic Kirkland site at all hours of the day.”
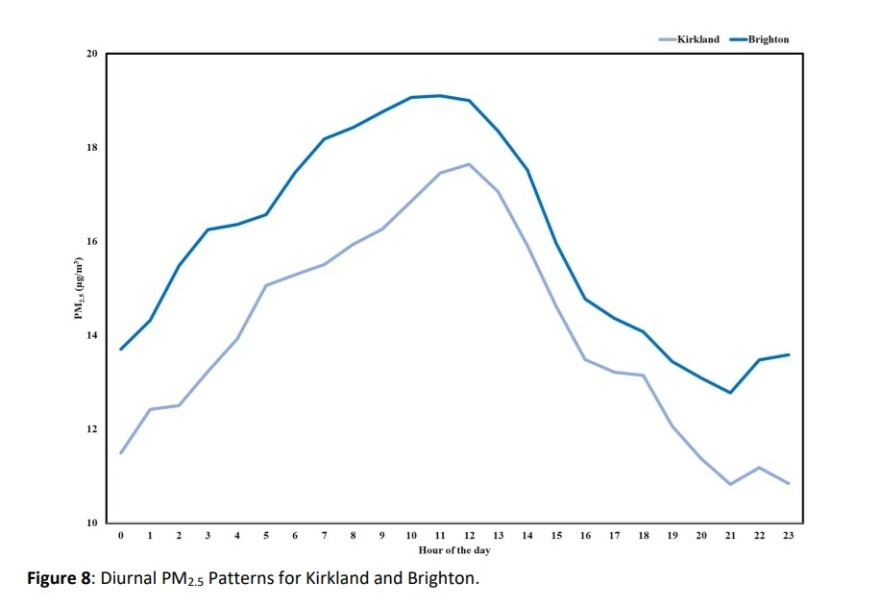
The “most profound finding” is that both sites share an identical temporal pattern, with a late-morning peak around 10 a.m. to 11 a.m., yet are offset by a near constant margin.
“This strongly suggests that the Kirkland site represents the general urban background pollution for a residential area, while the elevated concentrations at Brighton represent this same background plus a significant, additional pollution load directly attributable to the adjacent high-traffic roadway,” according to the analysis.
“This continuous elevation in concentration at the Brighton site implies a chronically higher daily exposure for residents, increasing the long-term health risks associated with traffic-related air pollution.”
Announced in August 2023, Lehigh Valley Breathes was expected to be a one-year project, but a slew of difficulties has caused the regional citizen science project to take longer than expected.
So far, the project has yielded preliminary findings in line with what officials have speculated — that air quality varies by location, with higher concentrations of PM 2.5 recorded in high-traffic areas.
And, fine particle pollution in the Valley is highest near warehouses and highways.
Researchers also have found PM 2.5 pollution occurs when the wind speeds are low, and conversely, when wind speeds are high, PM 2.5 pollution levels are low.
Residents are still able to view active monitors on ShinyApp, the project’s dashboard.
For more information, go to the Lehigh County and Northampton County websites for the project.